
How’s the Market? This is by far the Number One question we are asked as REALTORS. If asked at a cocktail party or BBQ, we might answer generally by saying something like “things are steady and pretty much the same over the last few months”, or “prices are starting to flatten out lately…” depending on what is happening in the market. But, if we talk with someone who really wants to understand how the real estate market is because they are about to become a home buyer, seller or investor, then we turn to the data and give them an informed and educated answer.
When working with our clients, we reference various market reports from different sources that examine the real estate market from different vantage points. We routinely look at market activity for all of San Diego County – for single family homes and condos and townhomes – and also dig into the data for particular zip codes or cities. We also examine the data for particular neighborhoods or subdivisions, and we get down to the granular level of analysis by looking at the historical sales data for a particular street or even one home. Zillow, Redfin, and Realtor.com can’t break down the data, the way our systems can.
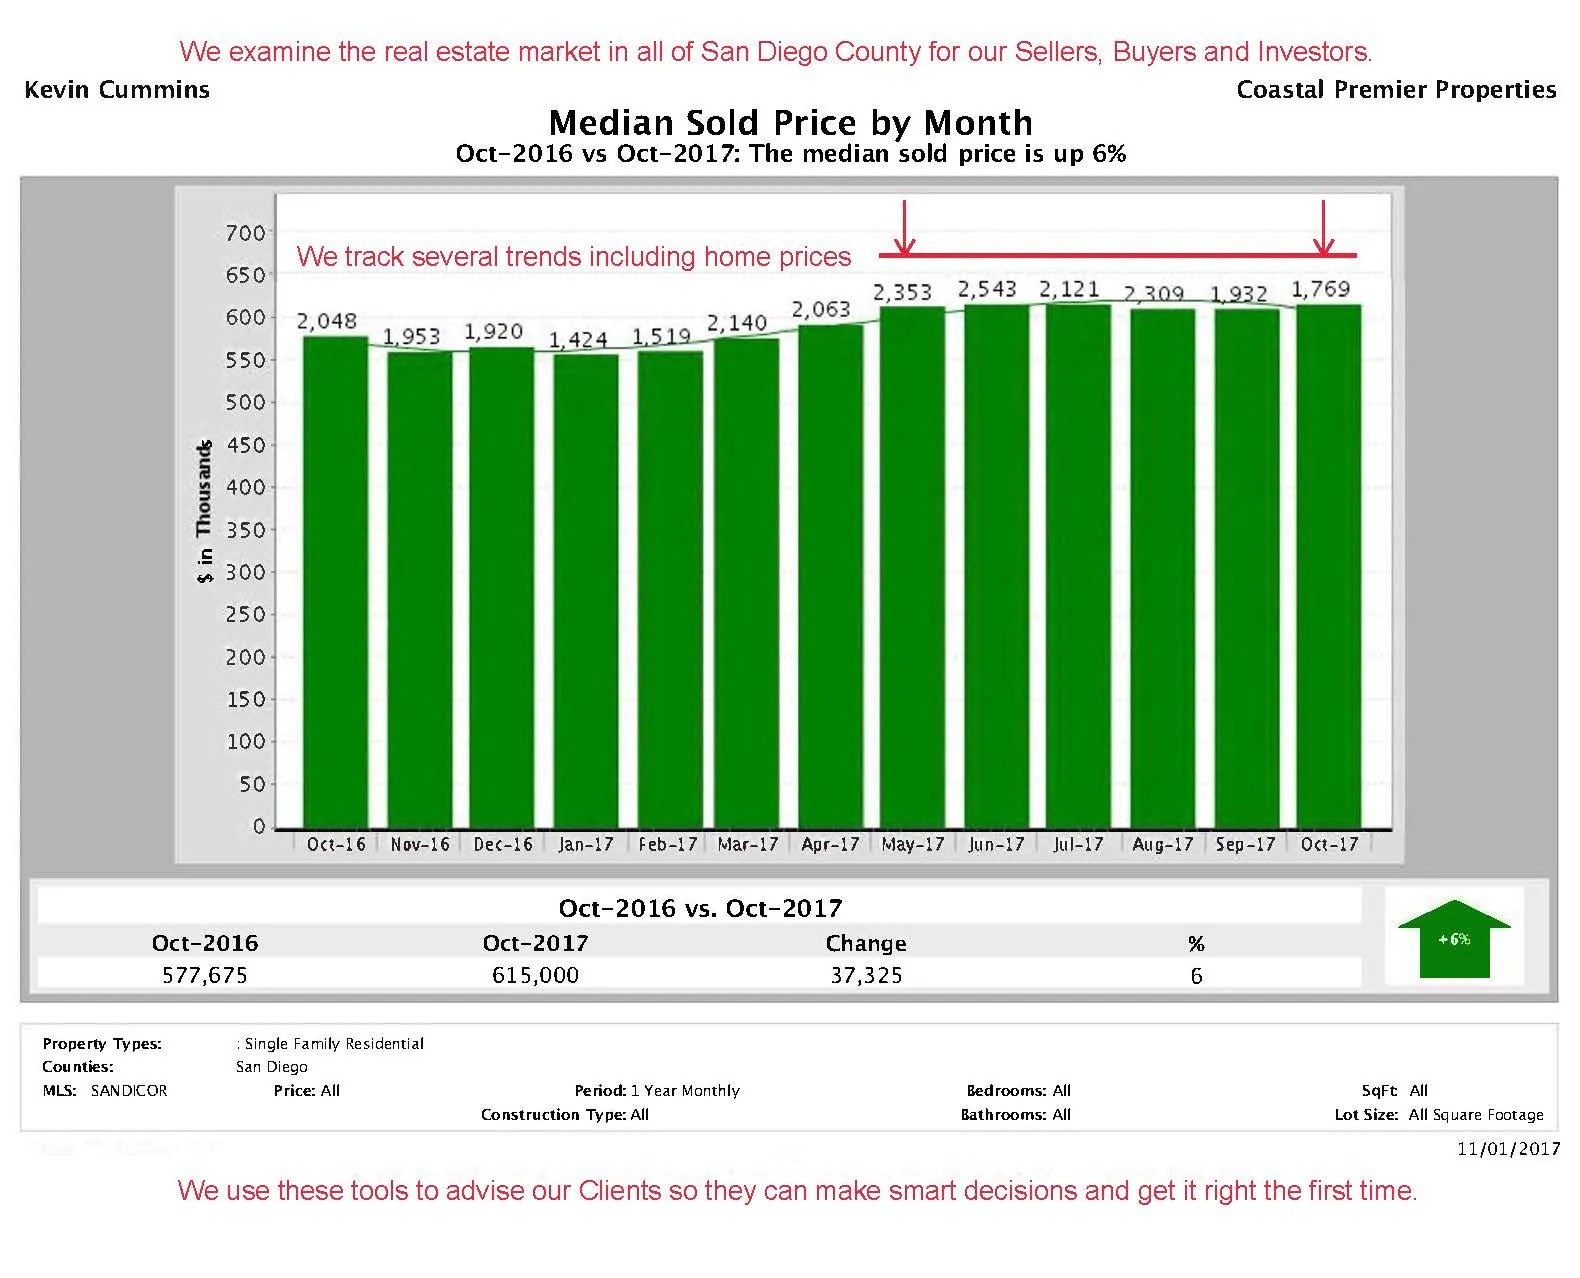
We use these reports (below) to look at 10 different data points for San Diego County. We examine the report details, such as how many sales there have been each month, as well as the bigger picture where we determine if trends are forming to see where the market is headed. What is happening with prices? Inventory levels? Supply and demand? We have the reports for all of San Diego. to help remove the guesswork.
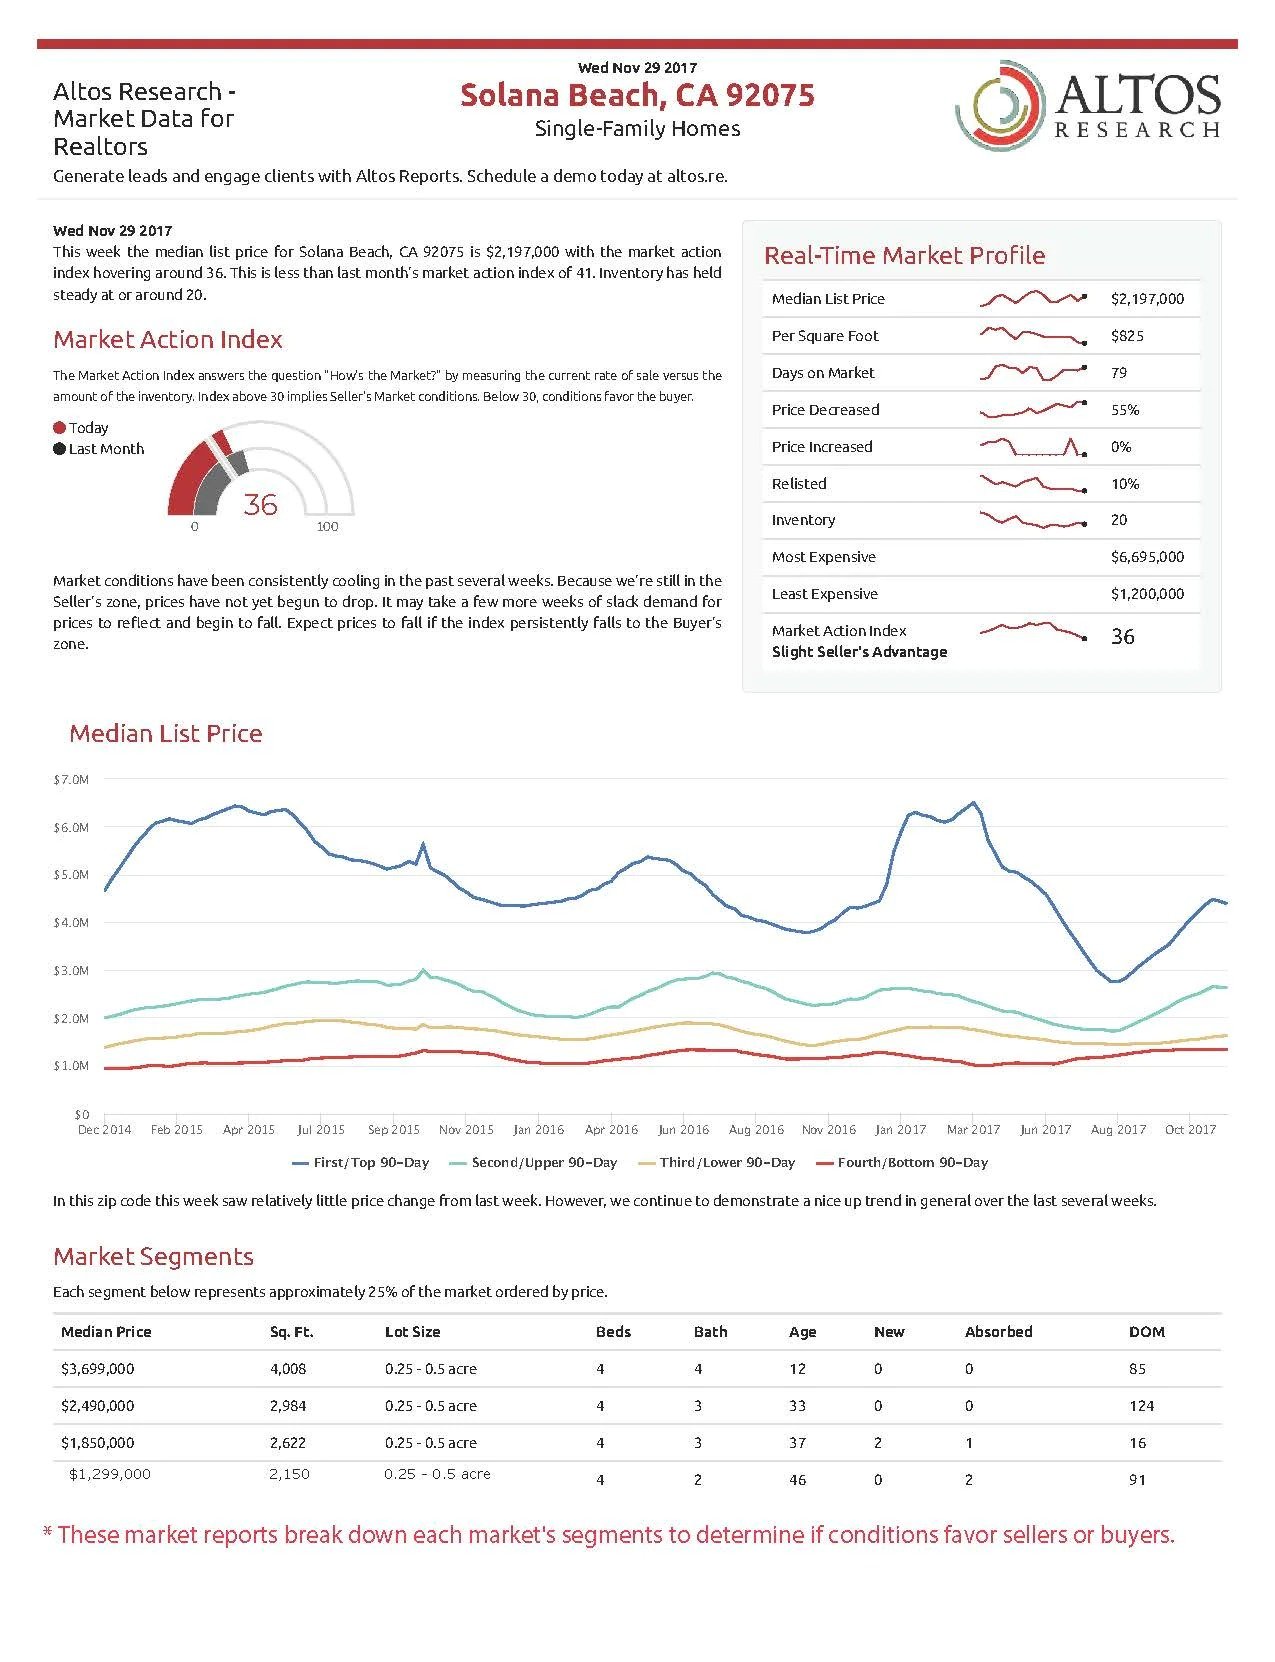
This report (below) provides additional market activity information on a specific city or zip code and provides further context and its data is collected as a weekly activity report. It even provides a Market Action Index which shows whether current conditions are favoring sellers or buyers.
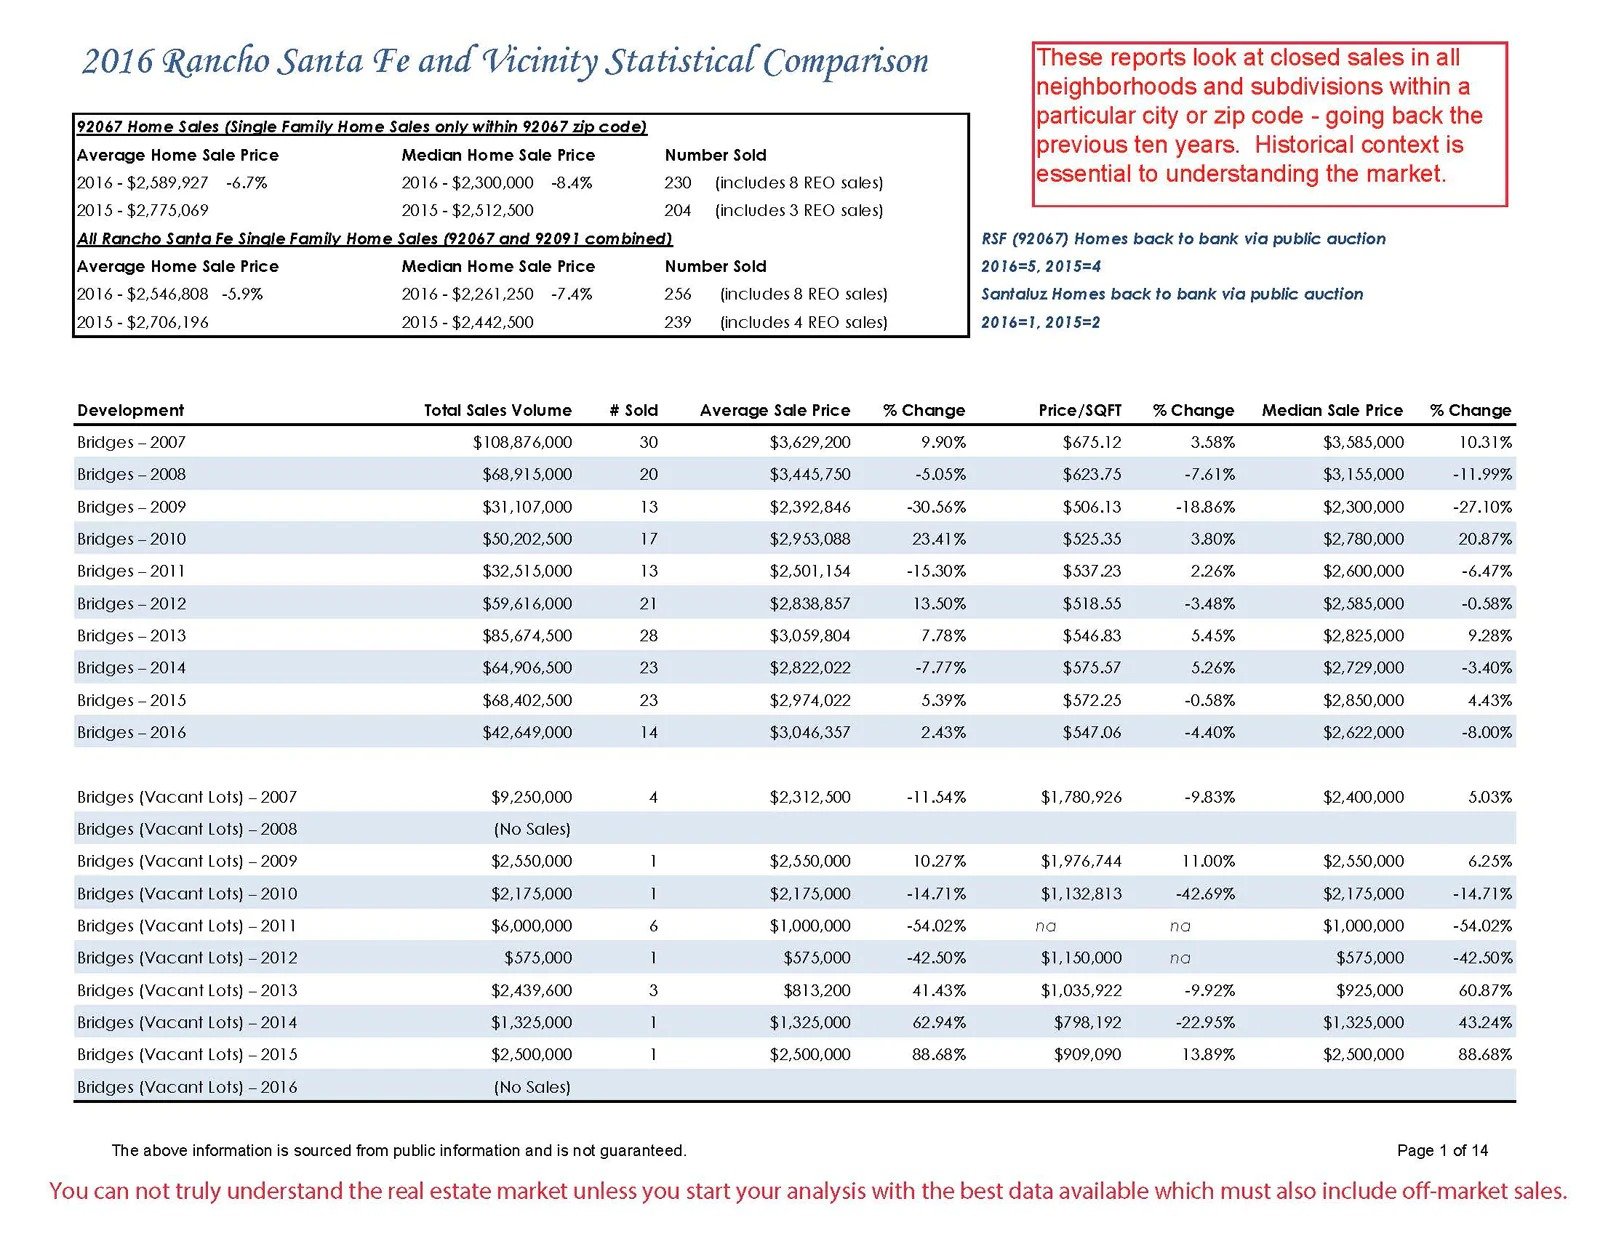
When it’s important to understand the historical sales activity in a particular neighborhood or subdivision, we have great reports from our title company that look at the previous ten years putting the sales data is in proper context. No need to guess what happened in past years when you have the right information!
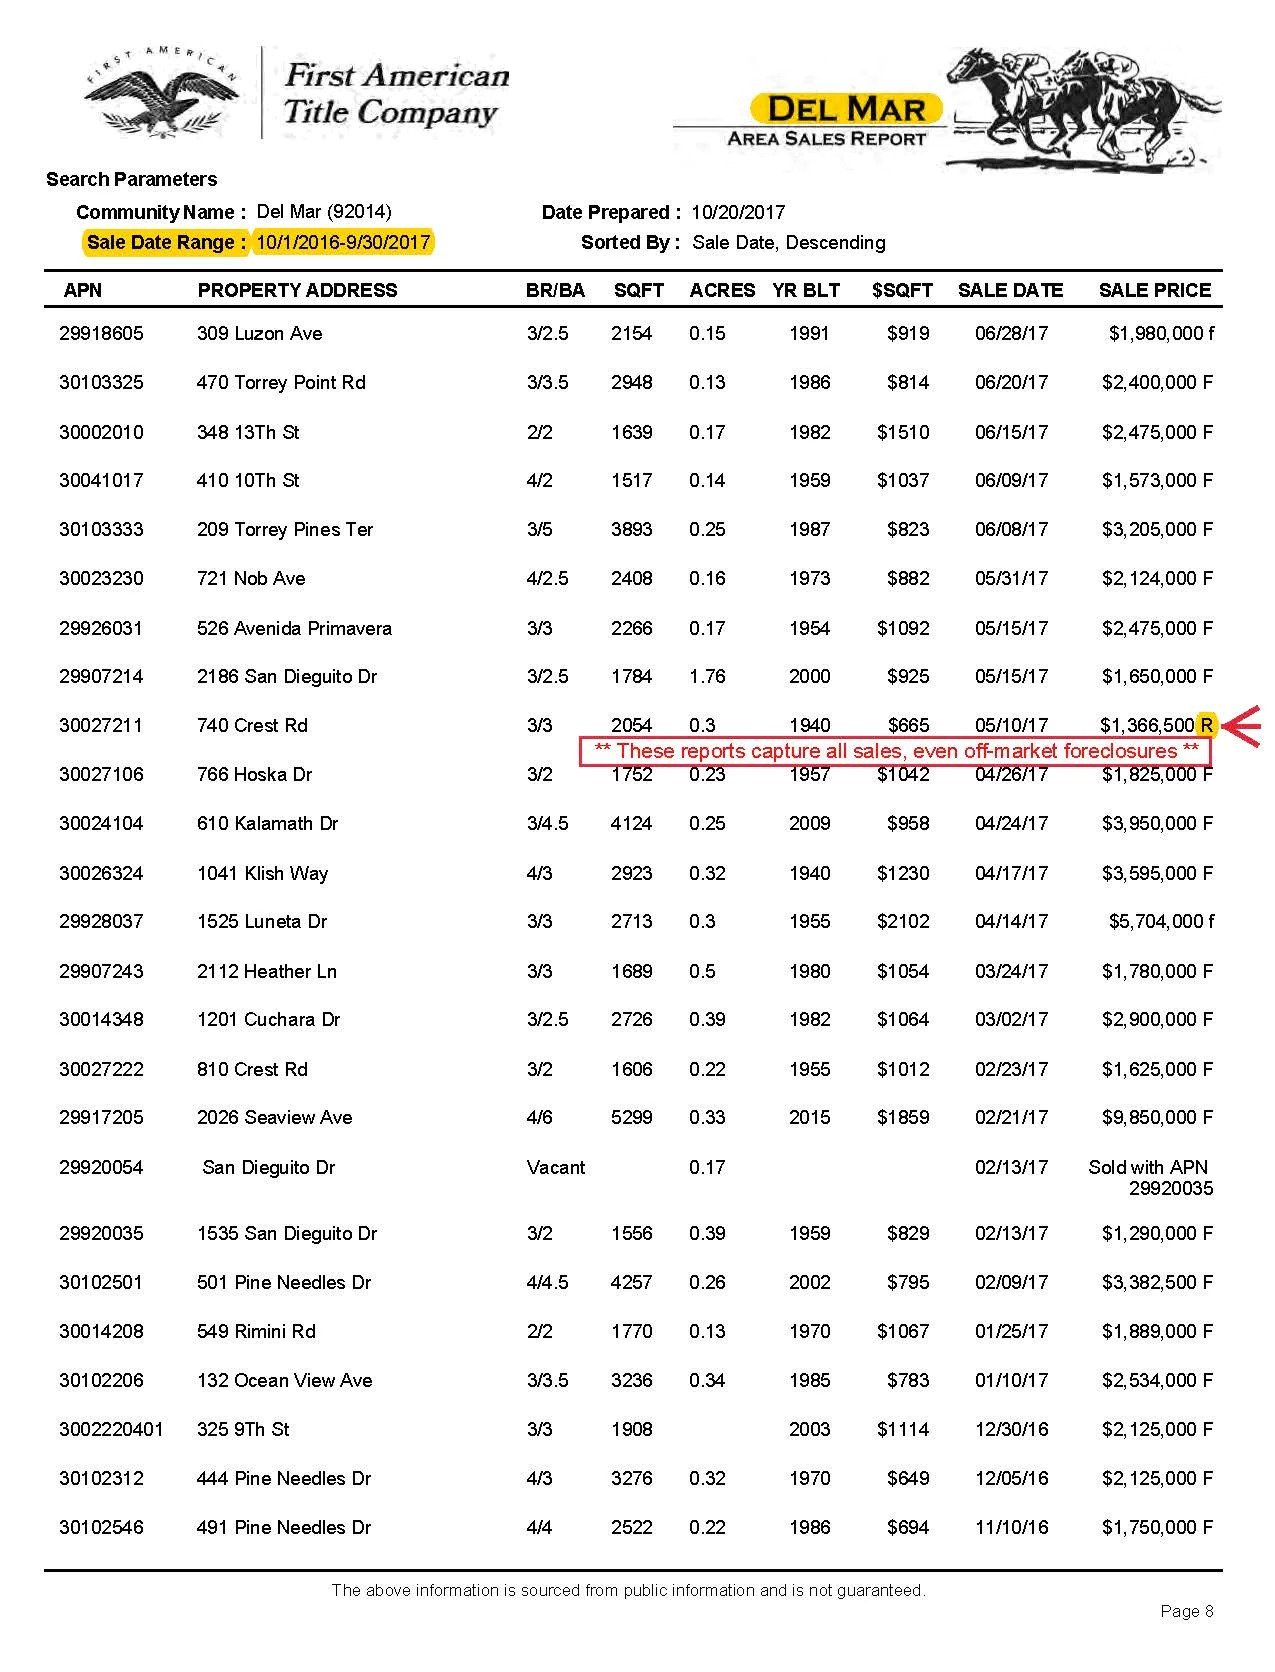
After examining the historical sales and averages, sellers and buyers always want to know about all of the specific sales within a certain neighborhood. This report (below) is a look at the “raw data” for everything that sold in a neighborhood or subdivision, including all off-market sales. The Multiple Listing Service (“MLS”) shows us what sold on the MLS system but does NOT show sales that occurred “off-market”, e.g., private sales without REALTORS, inter-family sales or transfers, bank foreclosures, etc. Accuracy matters, so we use the best reports to make sure our clients have all of the data they need when deciding where to price their listing or where to make an offer.
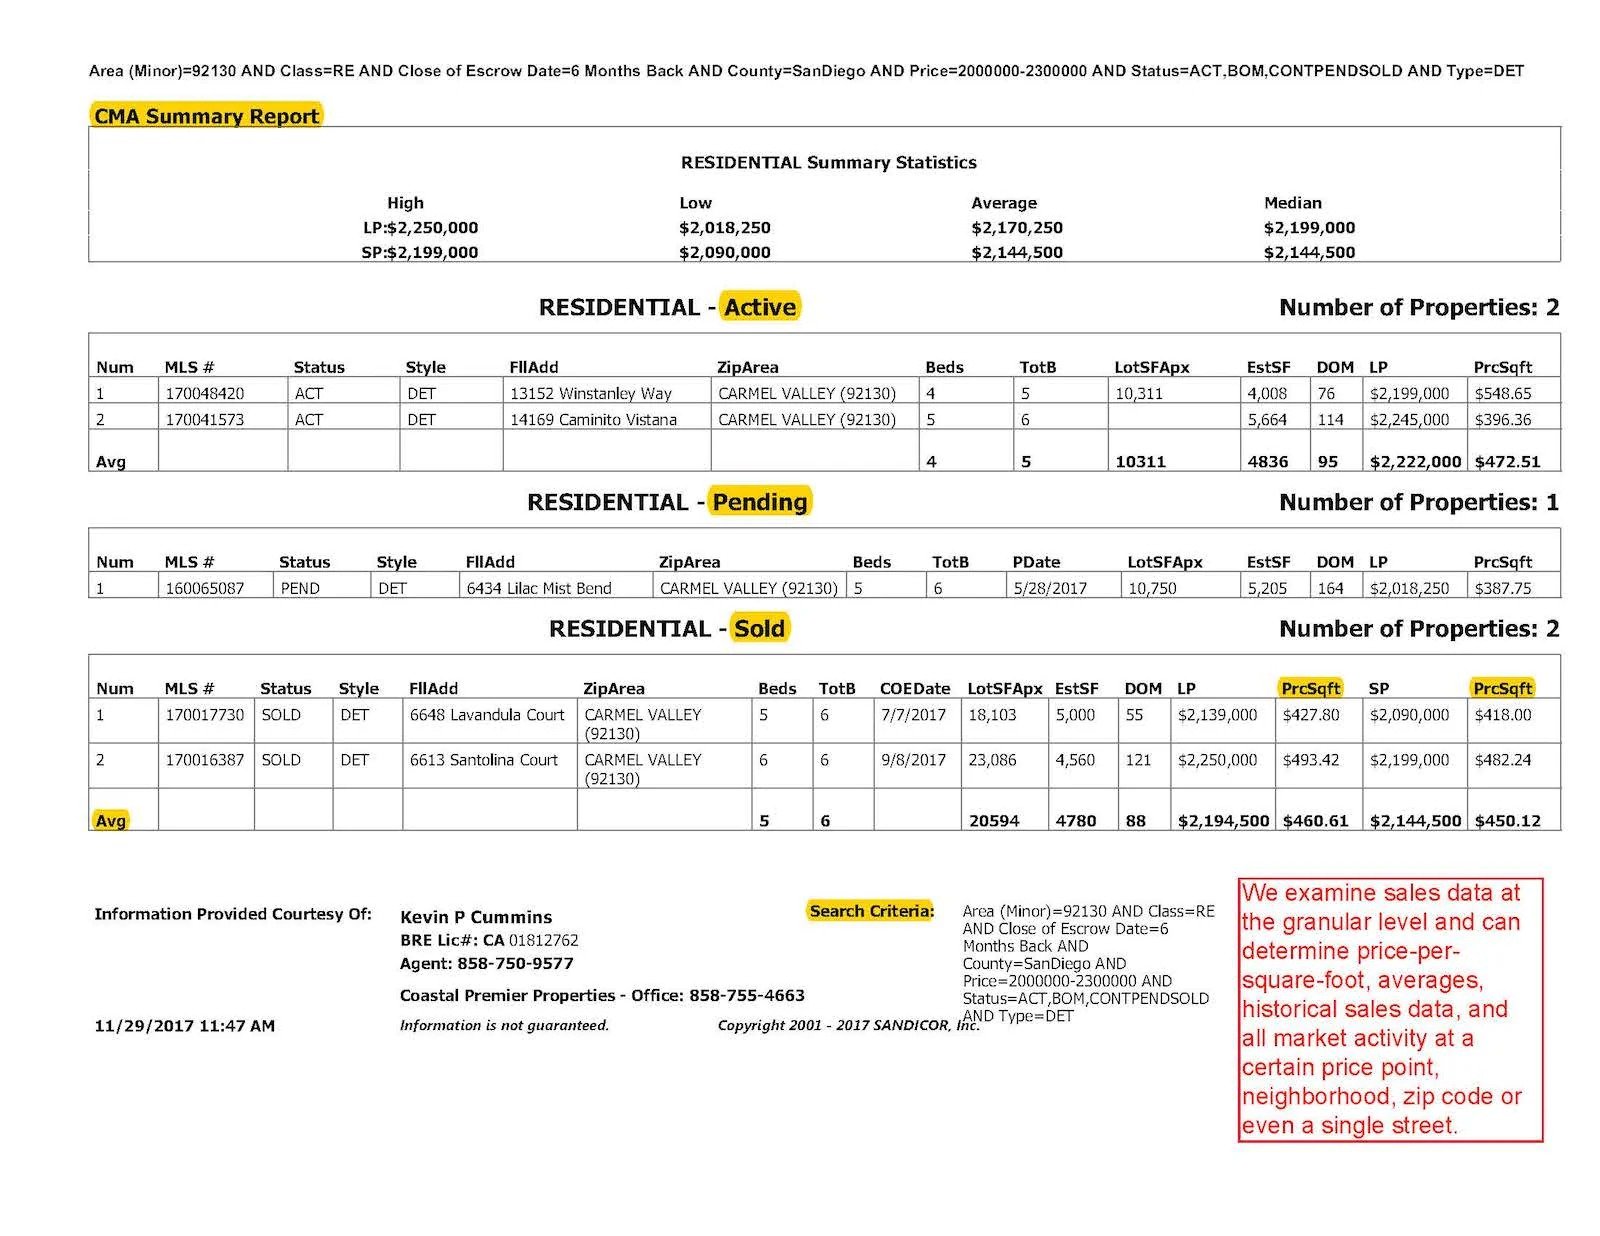
Finally, all sellers and buyers want to know “the price”. Sellers want to know where to set their list price, and buyers want to know where to make their offer based on the “Comps” (comparable sales data). These reports (below) can only be produced by the MLS. A great feature is that they provide averages, such as average list price, average sold price, or average price per square foot. We can also pull in listings that DID NOT sell, because almost as important as knowing what sold is also knowing what DID NOT sell. Our reports can pull the granular data in any way that is relevant to our client’s situation.
All of these reports are used in the context of our overall understanding of the San Diego real estate market. We go out each week to Broker Caravan and see new homes that come on the market so we can look out for our buyers and also be aware of the market’s latest offerings. We are constantly showing homes to our buyer clients, listing homes throughout the County, and we stay on top of the market first by spending time out “in the field” looking at homes and conferring with other agents. So, when we talk about Market Analysis as one of the services we provide for our clients, it involves a deep understanding of the market – from the up-close-and-personal view, as well as a clear understanding of the numbers. Goals are achieved by making good decisions at the right time, and good real estate decisions start with good analyses and good information. Contact us if you want a market analysis for your home or neighborhood.
Here are recent Market Analysis Reports for Single Family Detached Homes for ALL of San Diego County: